In Part 1, we established the baseline: MoE delivers 168 tok/s on a single RTX 3090, 4.1x faster than Dense. Clean single-request numbers. One prompt in, one response out.
That’s not how swarms work.
An orchestrator like Claude Code dispatches four coding tasks simultaneously. The local model serves all four. Under concurrency, memory bandwidth saturates, per-task throughput drops, and the architecture of the model — not the GPU, the model — determines whether you get useful parallelism or just contention.
Nobody had published the concurrent numbers. So we ran the tests ourselves.
This is Part 2 of the Local LLM Bench series. Part 1 covers the single-request baseline.
The Numbers That Matter
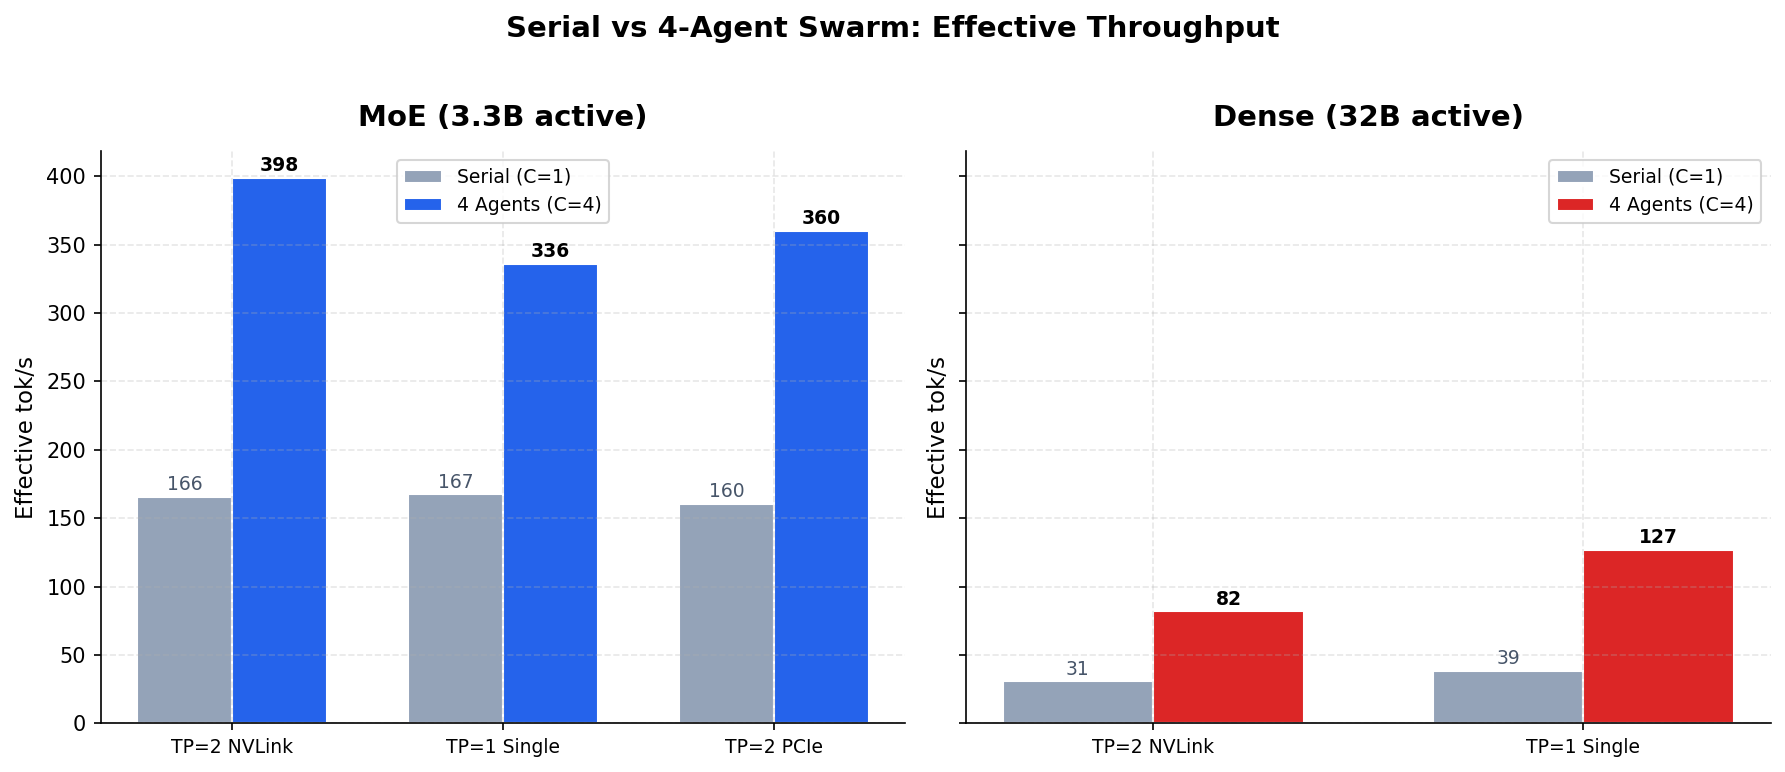
| Serial (1 agent) | Swarm (4 agents) | Speedup | |
|---|---|---|---|
| MoE (TP=2 NVLink) | 166 tok/s | 399 eff. tok/s | 2.83x |
| MoE (1x GPU) | 167 tok/s | 336 eff. tok/s | 2.06x |
| Dense (TP=2 NVLink) | 31 tok/s | 82 eff. tok/s | 3.07x |
| Dense (1x GPU) | 39 tok/s | 127 eff. tok/s | 5.53x |
MoE delivers 399 effective tok/s with 4 concurrent agents on two GPUs — completing a batch of 4 coding tasks in 26 seconds instead of 75. Even on a single $800 GPU, it sustains 336 eff. tok/s under full swarm load. Dense maxes out at 127.
MoE is 4.9x faster than Dense under swarm load. That ratio holds at every concurrency level we tested.
In our single-request benchmarks, MoE was 2.6-4.1x faster than Dense. The swarm numbers tell a stronger story — the gap widens under load, not narrows. I expected some advantage. I didn’t expect 4.9x.
How We Measured It
The test platform is my home lab — dual RTX 3090s with NVLink, custom liquid cooling, a 6 kW isolation transformer feeding a double-conversion UPS. I’ve written about the power topology before. GPU inference loads produce current transients during batch transitions that consumer power supplies absorb unpredictably. The dry-type transformer and online UPS eliminate that variable. Measurements on this platform reflect sustained capability under characterized conditions, not burst performance on a system whose power delivery is noise.
The orchestrator — Claude Code on Opus — runs on a separate workstation and dispatches coding tasks over the internal network. The LAN hop is part of the measurement. This is how you’d actually deploy it.
Dev Workstation                        Inference Server (ai01)
┌──────────────────────────┐           ┌──────────────────────┐
│ Claude Code (Opus)       │           │ vLLM · port 8000     │
│ ┌──────┐ ┌──────┐       │    LAN    │ 2x RTX 3090 NVLink   │
│ │ Agt 1│ │ Agt 2│ ...   │ ────────► │ 48GB VRAM            │
│ └──────┘ └──────┘       │           └──────────────────────┘
└──────────────────────────┘
The models
| MoE | Dense | |
|---|---|---|
| Model | Qwen3-Coder-30B-A3B AWQ-4bit | Qwen2.5-Coder-32B-Instruct AWQ |
| Total / Active params | 30B / 3.3B (8 of 128 experts) | 32B / 32B (all weights) |
| Quantization | AWQ 4-bit, Marlin kernels | AWQ 4-bit, Marlin kernels |
| Model size | 16.9 GB | 19.5 GB |
Same quantization, same kernels, same hardware. The only variable is architecture — whether the model activates 3.3 billion parameters per token or 32 billion. That 10x difference in active compute is the entire story.
Methodology
We tested three GPU configurations — dual-GPU NVLink, single GPU, and dual-GPU PCIe-only — with full server reboots between each (not just model restarts; NVIDIA driver state corruption from model unloading is a real confound). Sixteen unique coding prompts across four task types, with completely different prompts at each concurrency level to defeat vLLM’s prefix cache. Every request forces a cold prefill. Responses complete naturally — no max_tokens cap — because capping output creates artificial uniformity that masks real-world variance.
Warmup round at C=4 with dedicated prompts, then two measurement runs per concurrency level (C=1 through C=4).
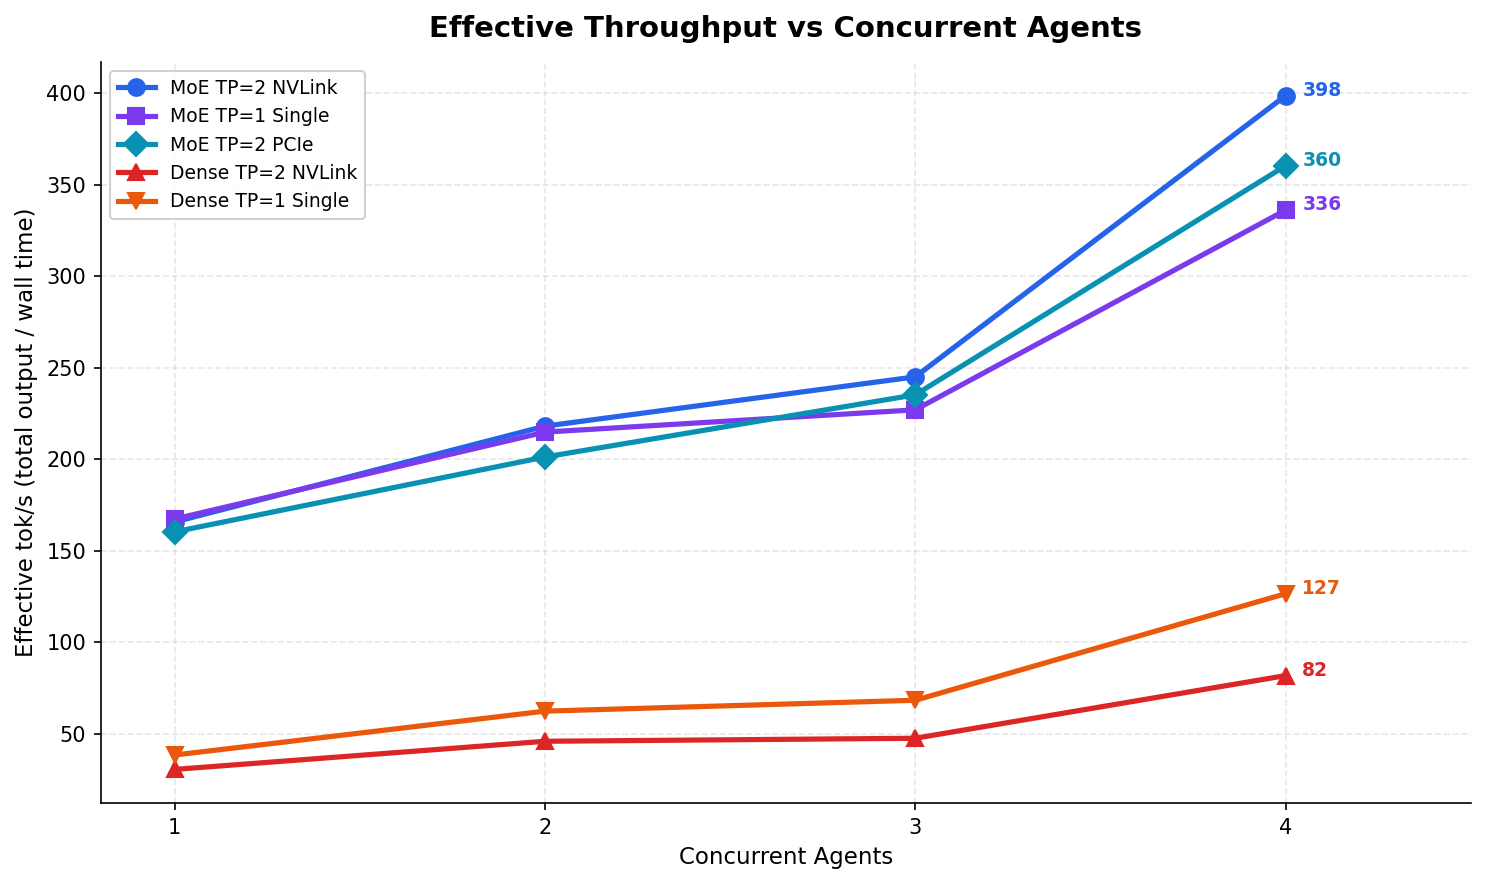
Effective Throughput Under Load
This is the metric that answers “should I run a swarm?” — total tokens produced per second of wall-clock time, across all concurrent tasks.
| Config | C=1 | C=2 | C=3 | C=4 |
|---|---|---|---|---|
| MoE TP=2 NVLink | 166 | 218 | 245 | 399 |
| MoE TP=1 Single | 167 | 215 | 227 | 336 |
| MoE TP=2 PCIe | 160 | 201 | 235 | 360 |
| Dense TP=2 NVLink | 31 | 46 | 48 | 82 |
| Dense TP=1 Single | 39 | 63 | 69 | 127 |
| Dense TP=2 PCIe | — | — | — | BROKEN |
Dense TP=2 PCIe couldn’t be tested at all — vLLM 0.17 nightly crashes with SIGBUS during weight loading when NVLink is disabled. Both the CUDA graph path and the eager-mode fallback fail. The MoE model runs all three configurations without issues. That’s itself a finding: MoE’s smaller active parameter footprint isn’t just faster, it’s more robust. Fewer parameters in flight means less sensitivity to interconnect quirks, driver bugs, and CUDA graph capture edge cases.
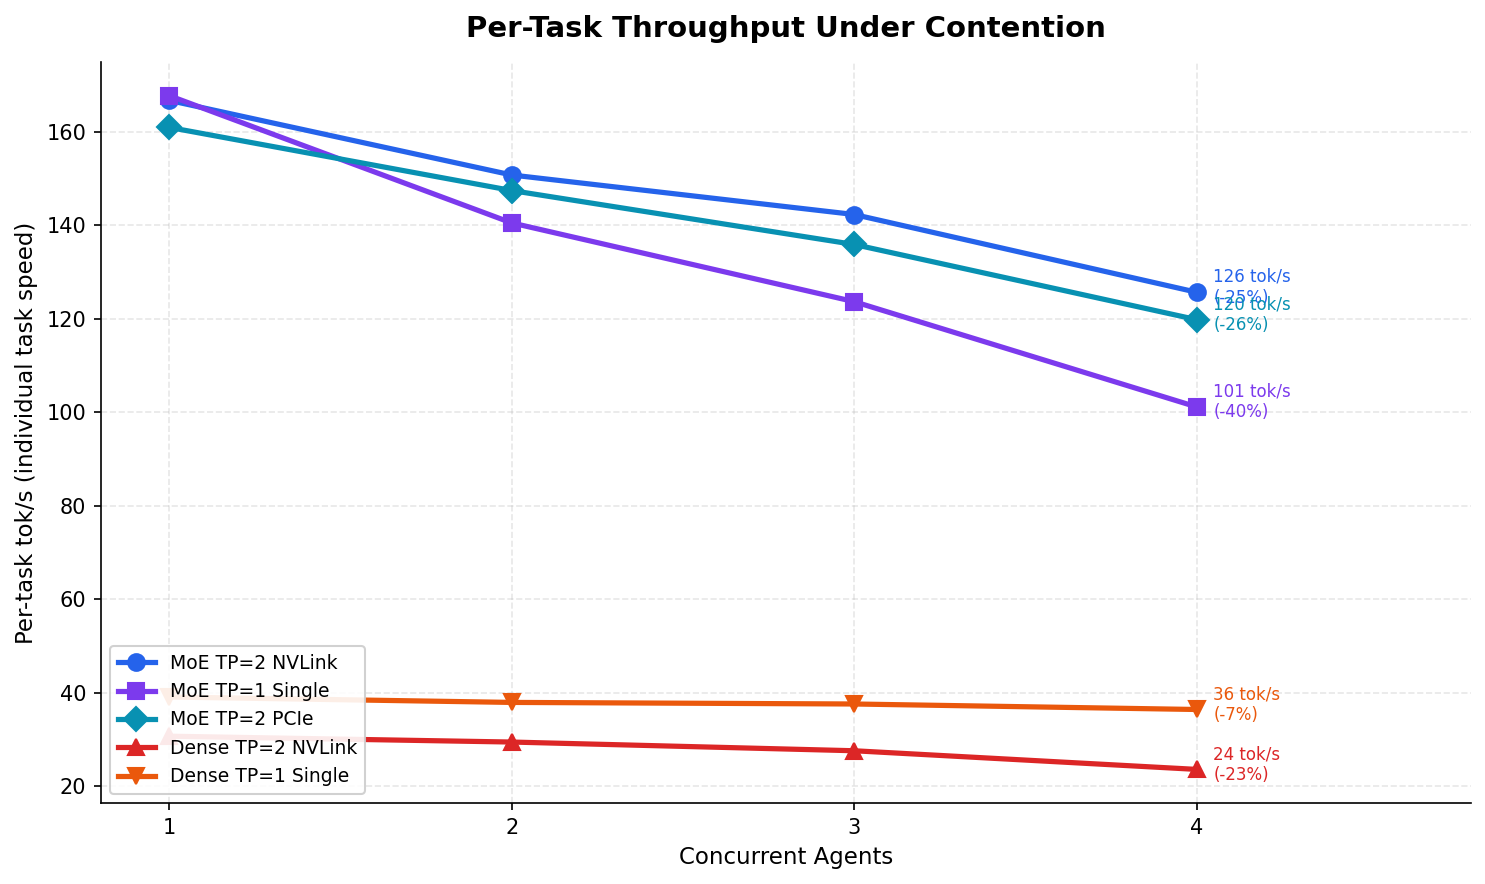
Contention — The Swarm Tax
Here’s where it gets counterintuitive. Contention measures how much each individual task slows down when sharing the GPU with other tasks.
| Config | C=1 per-task | C=4 per-task | Contention |
|---|---|---|---|
| MoE TP=2 NVLink | 167 tok/s | 126 tok/s | 25% |
| MoE TP=1 Single | 168 tok/s | 101 tok/s | 40% |
| Dense TP=2 NVLink | 31 tok/s | 24 tok/s | 23% |
| Dense TP=1 Single | 39 tok/s | 37 tok/s | 7% |
Dense shows lower contention than MoE. Dense TP=1 loses only 7% per-task throughput at C=4 while MoE TP=1 loses 40%. That looks like Dense handles concurrency better.
It doesn’t. Dense starts so slow that there’s no bandwidth to contend for. It’s like saying a bicycle has less wind resistance than a car — technically true, completely irrelevant. MoE drops from 167 to 101 tok/s on a single GPU under full swarm load, and 101 tok/s is still 2.7x faster than Dense’s best single-task speed.
The trade-off is clean: you give up 25% per-task speed to get 65% faster batch completion. Four coding tasks that take 75 seconds serial finish in 26 seconds concurrent. For agent workflows where the orchestrator dispatches independent tasks and waits for all to return, that’s not a trade-off. That’s the entire point.
NVLink Changes Its Story Under Load
In the single-request benchmarks, NVLink provided a 4% boost for MoE. I wrote at the time that NVLink was optional — nice to have, not worth chasing. Under swarm load, I have to walk that back.
| MoE Config | C=4 Effective tok/s | vs Single GPU |
|---|---|---|
| TP=2 NVLink | 399 | +19% |
| TP=2 PCIe | 360 | +7% |
| TP=1 Single | 336 | baseline |
At C=4, NVLink provides a 19% effective throughput advantage over single-GPU MoE. The all-reduce overhead that was invisible at batch size 1 compounds under concurrent load as GPUs synchronize more frequently. PCIe dual-GPU provides 7% — enough to notice, not enough to justify the complexity if NVLink isn’t already in the system.
But the real surprise wasn’t NVLink. It was the single GPU.
One GPU Is Enough
MoE on a single RTX 3090 delivers 336 effective tok/s at C=4. That’s more than 4x the effective throughput of Dense on two GPUs with NVLink.
Read that again. One $800 GPU running the MoE model under swarm load outperforms two GPUs with NVLink running Dense by a factor of four. The per-task contention is higher on single GPU — 40% versus 25% on dual — which means each individual task takes longer. But 101 tok/s per task at C=4 is still fast enough for interactive agent loops. A 2,000-token function implementation completes in about 20 seconds per agent, with four agents working in parallel.
Context is limited to ~16K tokens on a single GPU, which is enough for most single-function coding tasks. Add a second GPU when you need 131K context for large codebases, or to reduce per-task latency from 101 to 126 tok/s under swarm load. Not because you need the compute — because you need the VRAM.
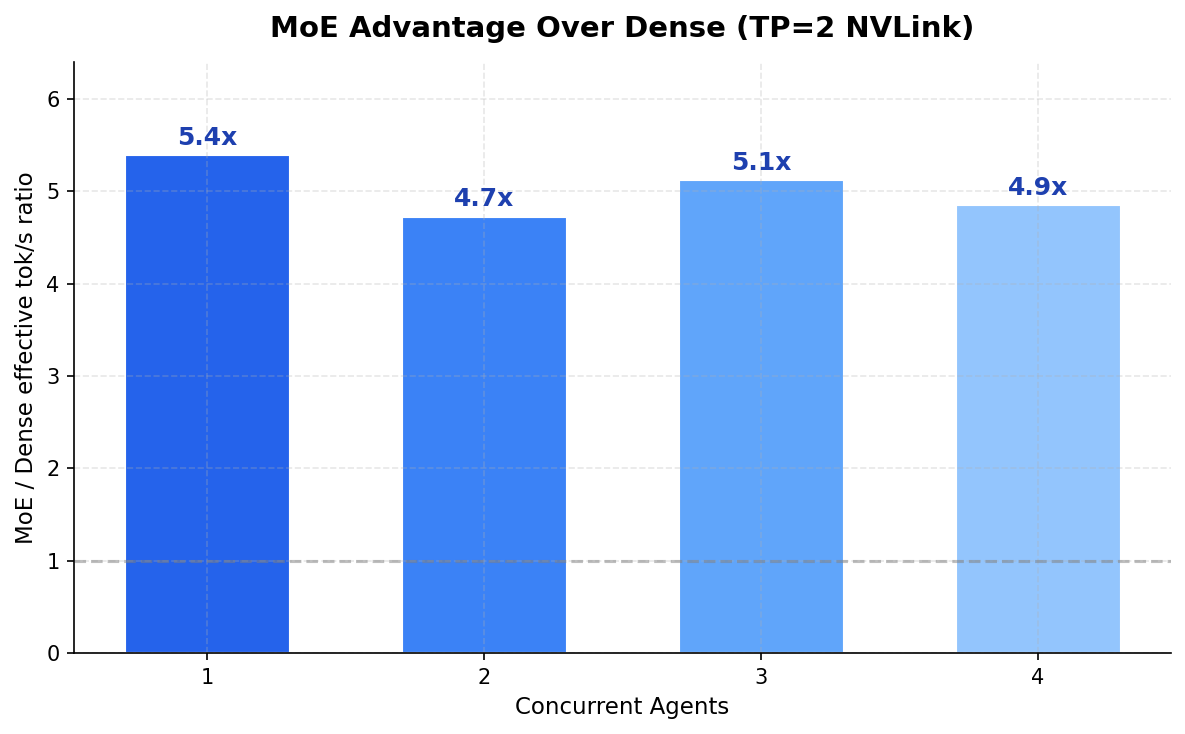
| Concurrency | MoE eff. tok/s | Dense eff. tok/s | MoE Advantage |
|---|---|---|---|
| 1 agent | 166 | 31 | 5.4x |
| 2 agents | 218 | 46 | 4.7x |
| 3 agents | 245 | 48 | 5.1x |
| 4 agents | 399 | 82 | 4.9x |
The ratio holds across every concurrency level. 4.7x to 5.4x. MoE’s 3.3B active parameters leave enough memory bandwidth headroom to absorb the contention penalty without hitting a wall. Dense activates all 32B on every token — it’s already at the bandwidth ceiling before the second agent even connects.
Wall-Clock Speedup
The number that matters if you’re managing a workflow: how much faster does a batch of 4 coding tasks complete?
| Config | Serial | Swarm (C=4) | Speedup |
|---|---|---|---|
| MoE TP=2 NVLink | 74.5s | 26.3s | 2.83x |
| MoE TP=1 Single | 57.1s | 27.7s | 2.06x |
| Dense TP=2 NVLink | 229.1s | 74.7s | 3.07x |
| Dense TP=1 Single | 218.3s | 39.5s | 5.53x |
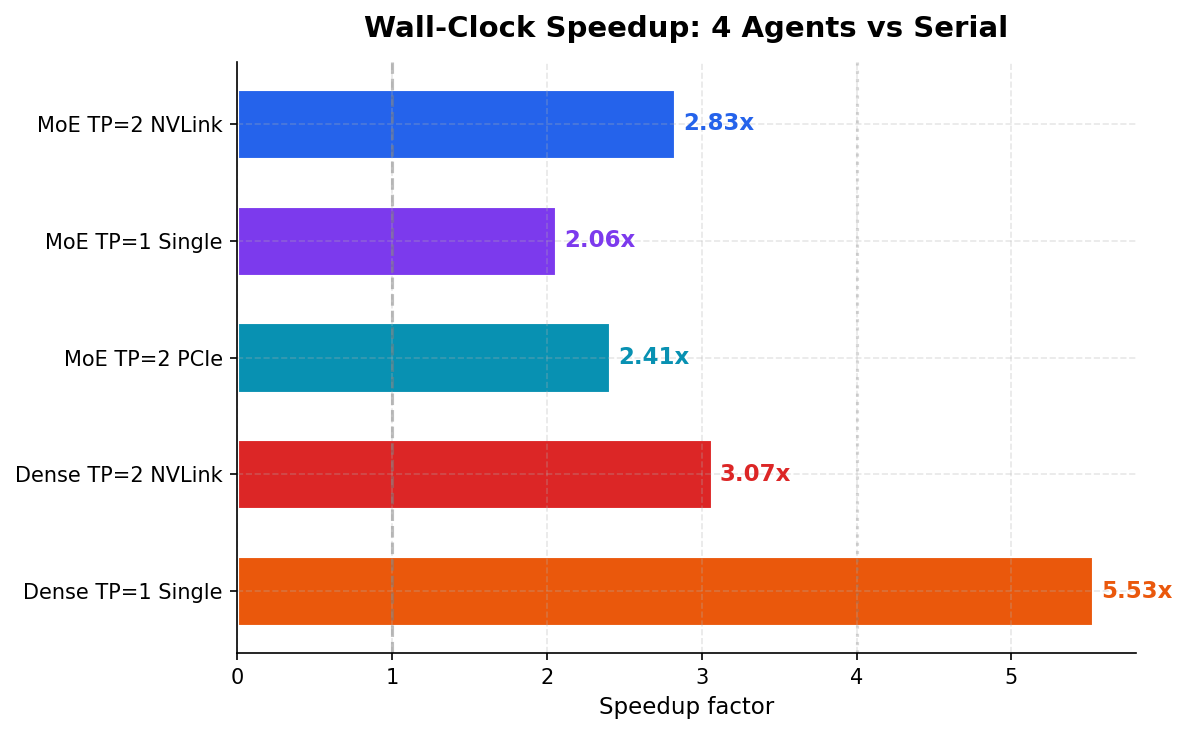
The Dense TP=1 speedup — 5.53x at C=4 — looks suspiciously super-linear. It is. One serial run had a test-generation prompt that hit the 8192-token cap at 221 seconds, inflating the baseline. The clean speedup is closer to 3.1x. We’re reporting both because the methodology is the methodology — you don’t throw out runs that embarrass you.
vLLM Configuration That Actually Works
This cost us more debugging hours than the benchmarks themselves. For anyone running consumer Ampere GPUs with vLLM 0.17:
| Flag | Why |
|---|---|
--disable-custom-all-reduce | Required — custom all-reduce crashes on SM 8.6 during CUDA graph capture |
--enable-chunked-prefill | Better memory efficiency for concurrent requests |
--max-num-seqs 4 | Match max concurrency level |
--gpu-memory-utilization 0.92 | Max safe value for TP=2 (0.95 for TP=1 Dense) |
--enforce-eager | Required for Dense — V1 engine CUDA graphs crash |
--dtype float16 | Required for AWQ/GPTQ models |
One note: the RTX 3090 lacks native FP8 Tensor Core instructions. FP8 models work through software decompression but run 13% slower than AWQ 4-bit. Always use AWQ or GPTQ on consumer Ampere.
What We Didn’t Measure
Where MoE contention hits diminishing returns — C=6, C=8. The bandwidth math suggests C=6 on dual GPU should still be productive, but we haven’t tested it. Prefill-heavy workloads with 8K+ system prompts stress the pipeline differently. And whether per-task code quality degrades under contention — temperature and sampling are independent of throughput, so the hypothesis is no, but it’s worth verifying.
The Decision
Part 1 said MoE was faster. The swarm benchmarks say it’s not even close.
For the emerging pattern of orchestrator-plus-swarm development — where Claude, GPT-4, or a planning model dispatches parallel coding tasks to a local inference server — MoE on consumer GPUs is the architecture. One RTX 3090. Qwen3-Coder. Four agents. 336 effective tok/s. That setup handles concurrent coding tasks faster than any Dense configuration at any price point on this hardware class.
Dense models still make sense for non-interactive workloads where quality per token outweighs speed. But for the swarm pattern — where you’re trading individual throughput for aggregate throughput, where the orchestrator dispatches and waits — MoE’s bandwidth headroom is the entire story. 3.3 billion active parameters means there’s always room for one more agent.
One GPU is enough. That’s the finding nobody expected.
What Comes Next
Dense is out. The numbers are conclusive across every configuration and concurrency level — there’s no scenario where Dense wins for interactive swarm workloads on consumer hardware. Future benchmarks in this series test MoE only.
The next question: where does that bandwidth headroom actually run out?
At C=1, the model activates 3.3B parameters per token against 936 GB/s of memory bandwidth. Roughly 10% utilization. That’s why four concurrent agents don’t destroy per-task throughput — there’s bandwidth to spare. But the contention penalty we measured (167 → 101 tok/s, 40% on single GPU) is gentler than the raw math predicts, and the reason is interesting.
MoE routes each token through 8 of 128 experts. Under concurrent load, the frequently-activated experts — the ones most tokens route through — stay resident in GPU L2 cache. When the next request routes a token through the same expert, the weights are already there. No main memory round-trip. The model’s sparse activation pattern creates natural cache locality that dense architectures can’t exploit, because dense models read all 32 billion parameters on every token regardless of what’s cached. It’s the same principle that makes CPU branch prediction effective — the hot path stays warm.
That locality has a ceiling. At some concurrency level the L2 thrashes, the bandwidth saturates, and per-task throughput doesn’t just degrade — it craters.
Here’s the thing: the RTX 3090 has a 6 MB L2 cache. That’s the smallest in the current consumer lineup — and it’s where all of this parallelism-versus-contention behavior lives. Each MoE expert slice at AWQ-4bit is roughly 530 KB, so 6 MB holds maybe 10-11 hot experts before eviction starts. That’s tight. For context:
| GPU | L2 Cache | VRAM | VRAM Bandwidth |
|---|---|---|---|
| RTX 3090 (Ampere) | 6 MB | 24 GB GDDR6X | 936 GB/s |
| RTX 4090 (Ada) | 72 MB | 24 GB GDDR6X | 1,008 GB/s |
| RTX 5090 (Blackwell) | 128 MB | 32 GB GDDR7 | 1,792 GB/s |
A 4090 has 12x the L2. A 5090 has 21x. On a 72 MB cache, you could hold 130+ expert slices — essentially every frequently-routed expert stays resident. The contention penalty at C=4 would be significantly lower, and the saturation cliff would shift to much higher concurrency. We can’t directly compare data center GPUs here — HBM bandwidth and L2 sizes are in a different class — but that’s not the point. These benchmarks are about hardware you can actually acquire. Used RTX 3090s, new 4090s, eventually 5090s. Consumer devices, home labs, small teams.
The 3090’s 6 MB L2 is the worst case for MoE concurrent inference in the current consumer lineup. If the architecture handles four agents this well on the smallest cache available, it only gets better from here.
Part 3 finds the cliff on this hardware. Qwen3-Coder, single RTX 3090, C=4 through saturation. Same methodology, same hardware. One variable: how many agents before the physics says stop.
Benchmarked March 7, 2026. Hardware: dual RTX 3090 NVLink, custom liquid cooling, 6 kW isolation transformer + double-conversion UPS. Software: vLLM 0.17, CUDA 12.8.