
URE Atlas: Visualizing the Hidden Cost of AI Infrastructure Placement
A 10ms latency difference affects 50M users. A 5% inefficiency costs $3M monthly. Yet infrastructure decisions are made blind. Atlas transforms $60M/week in cloud chaos into visual intelligence, exposing $11M in waste and why us-east-1 dominance is fear, not optimization.
A field note on unified capacity planning for multi-cloud AI workloads
The Problem We're Not Talking About
Every week, AI companies burn millions on cloud infrastructure while making placement decisions in the dark. The real cost isn't just the AWS or GCP invoice—it's the compound effect of latency on user experience, stranded capacity from poor workload distribution, and the invisible tax of managing multiple clouds as separate entities.
At scale, a 10ms latency difference affects 50 million users. A 5% capacity inefficiency costs $3M monthly when you're spending $60M. Yet most organizations track these metrics in isolation, missing the forest for the trees.
Atlas emerged from a simple question: What if we could see infrastructure decisions the way they actually impact the business?
The Atlas Approach: Making Infrastructure Visible
Atlas transforms cloud complexity into visual intelligence. Rather than drowning in metrics, it presents infrastructure through three lenses: financial impact, population reach, and performance implications.
Understanding Current State: The Quarterly View
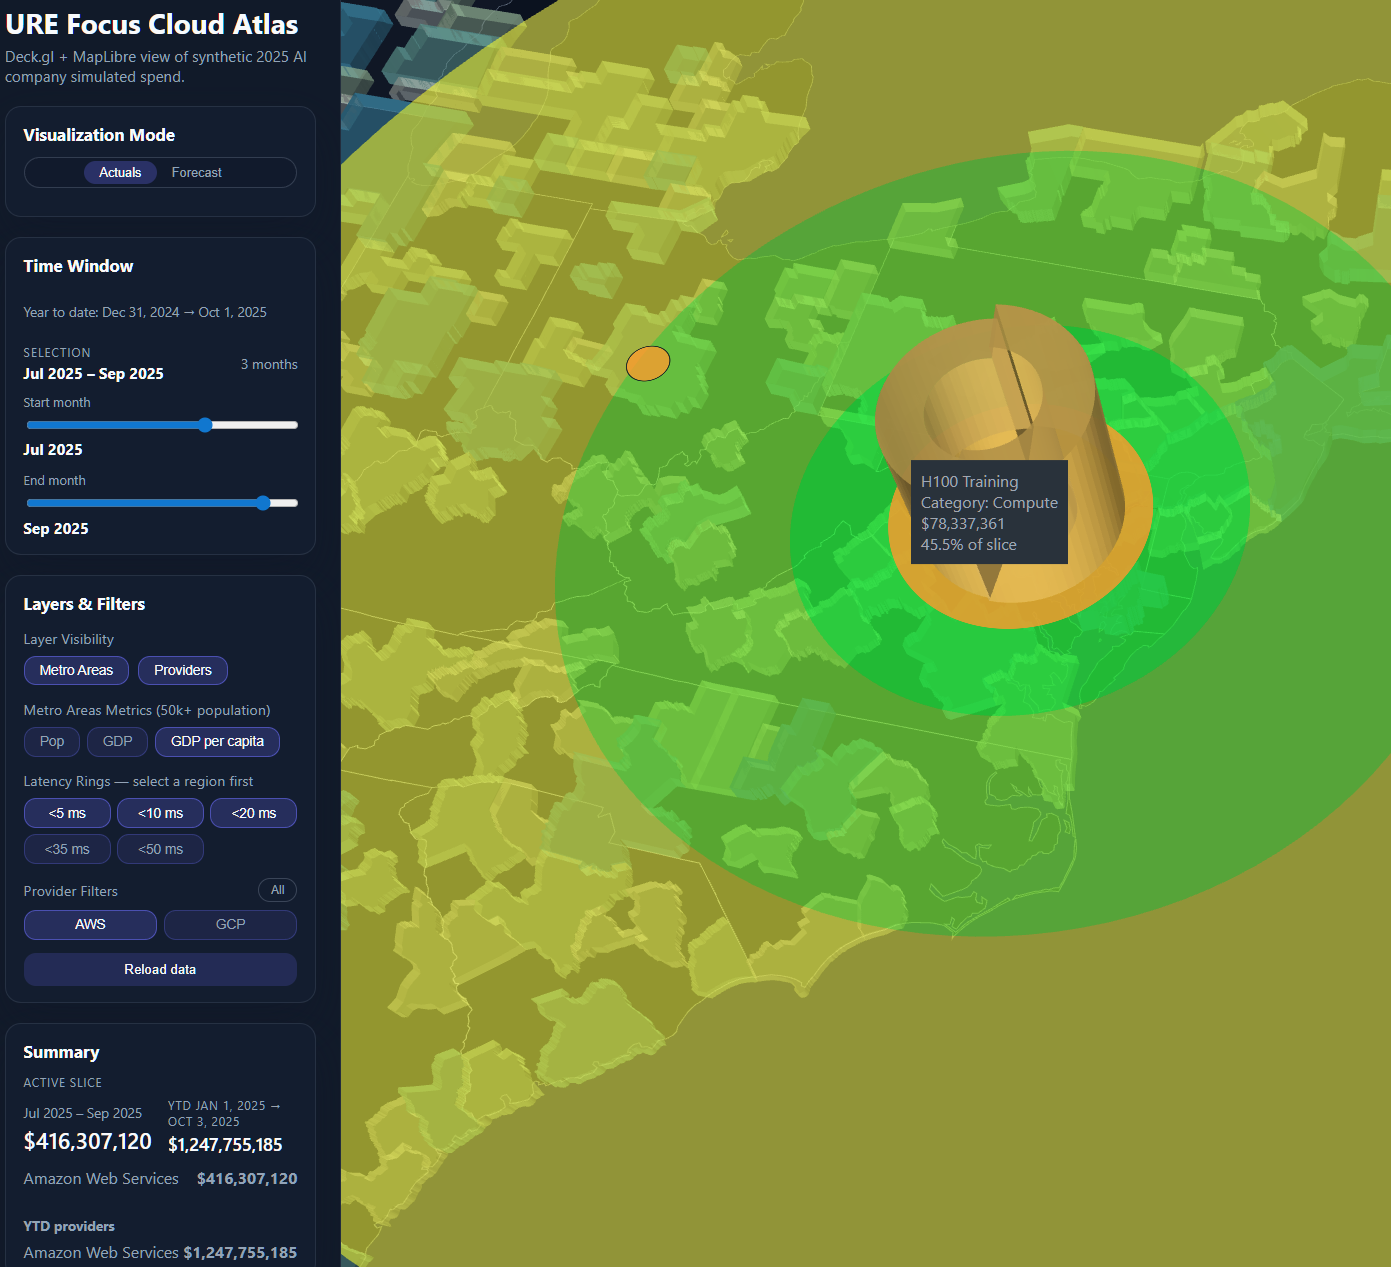
This quarterly view reveals $416M in cloud spend over three months, annualizing to $1.67B. Notice how H100 Training dominates at 45.5% of total compute costs—a pattern invisible in traditional cloud billing. The AWS dominance ($1.25B annualized) versus GCP tells a story of technical debt: workloads placed by history, not optimization.
The Innovation: Latency Rings Reveal Hidden Impact
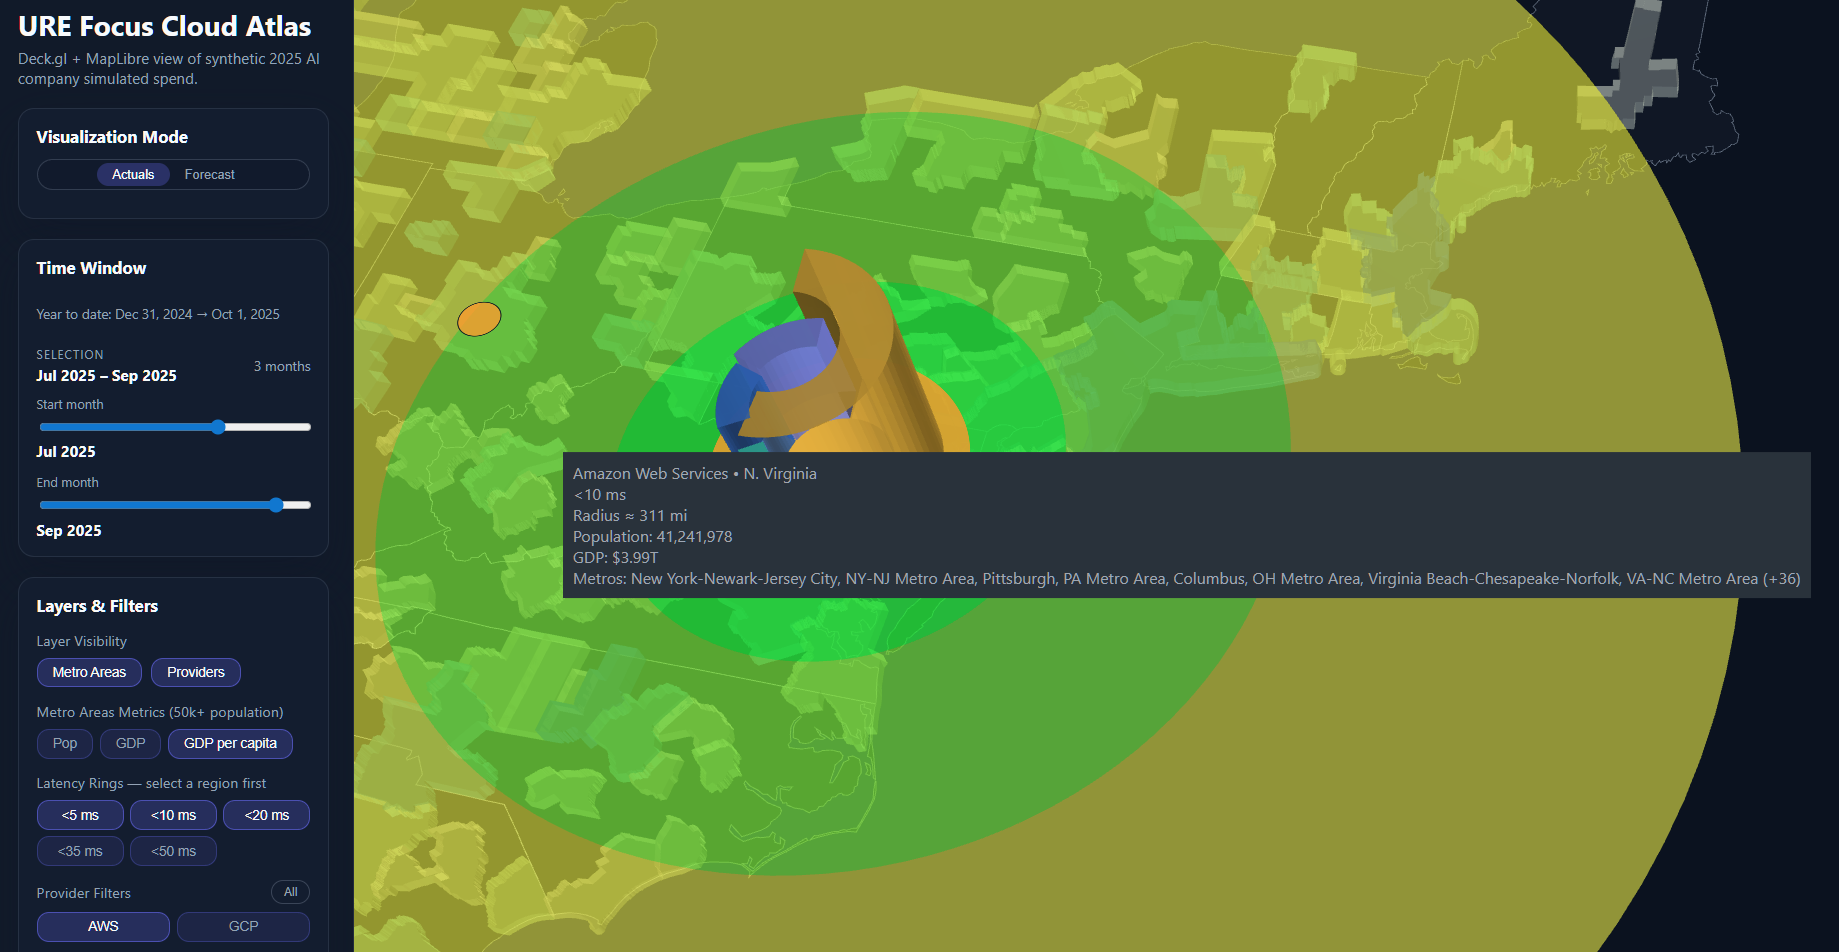
The latency rings transform abstract milliseconds into concrete impact. That orange center in Northern Virginia isn't random—it's optimal. Within the <10ms green zone: 41.2 million people and $3.99T in GDP. Each ring outward represents degraded user experience and increased resource consumption. A 10ms increase in latency requires 15% more compute resources to maintain the same perceived performance.
This visualization answers the critical question: Are we optimizing for our infrastructure or our users?
Exposing Hidden Complexity: The Service Breakdown

This deep dive into us-east-1's $172M quarterly spend reveals a critical distinction often missed in cloud cost analysis. Looking at the breakdown panel (bottom right), the Compute category ($172M) splits into fundamentally different workloads:
Training Infrastructure - The heavyweight consumers:
- Trainium Training: $94M—Amazon's custom silicon for model training
- H100 Training: $78M—NVIDIA's flagship GPUs for frontier models
Model Serving - The growing operational cost:
- Bedrock Inference: $56M—AWS's managed AI platform for production deployment
Here's the uncomfortable truth: these training deployments are almost always "set-and-forget." An engineer spins up H100s or Trainium instances for a critical model, it works, and nobody touches it again. The mission-critical nature creates a "don't break what's working" culture. Meanwhile:
- GCP might offer 30% lower costs for equivalent compute
- AWS might have launched new instance types in the same region with better price-performance
- The workload might run perfectly on Trainium instead of expensive H100s (or vice versa)
That $172M in compute? Probably contains $30-40M in optimization opportunities that nobody will pursue because "we can't risk disrupting training." This institutional inertia costs more than the infrastructure itself—it prevents organizations from experimenting with better solutions.
The supporting infrastructure compounds this lock-in:
- Storage: $47M—Growing infinitely because nobody deletes old checkpoints
- Network Egress: $15.7M—Paying premium rates for cross-region movement that could be eliminated
- Parallel FS: $12.5M—High-performance storage that might be overkill for half the workloads
The latency coverage panel confirms why us-east-1 dominates despite its premium pricing: within 10ms, it reaches the entire Eastern corridor. But this geographic advantage becomes a crutch—everything gets deployed there by default, even workloads that don't need low latency.
The real insight: Infrastructure decisions made in urgency become permanent through fear. That $78M H100 cluster? Probably started as a "temporary" solution six months ago.
Learning from History: Pattern Recognition
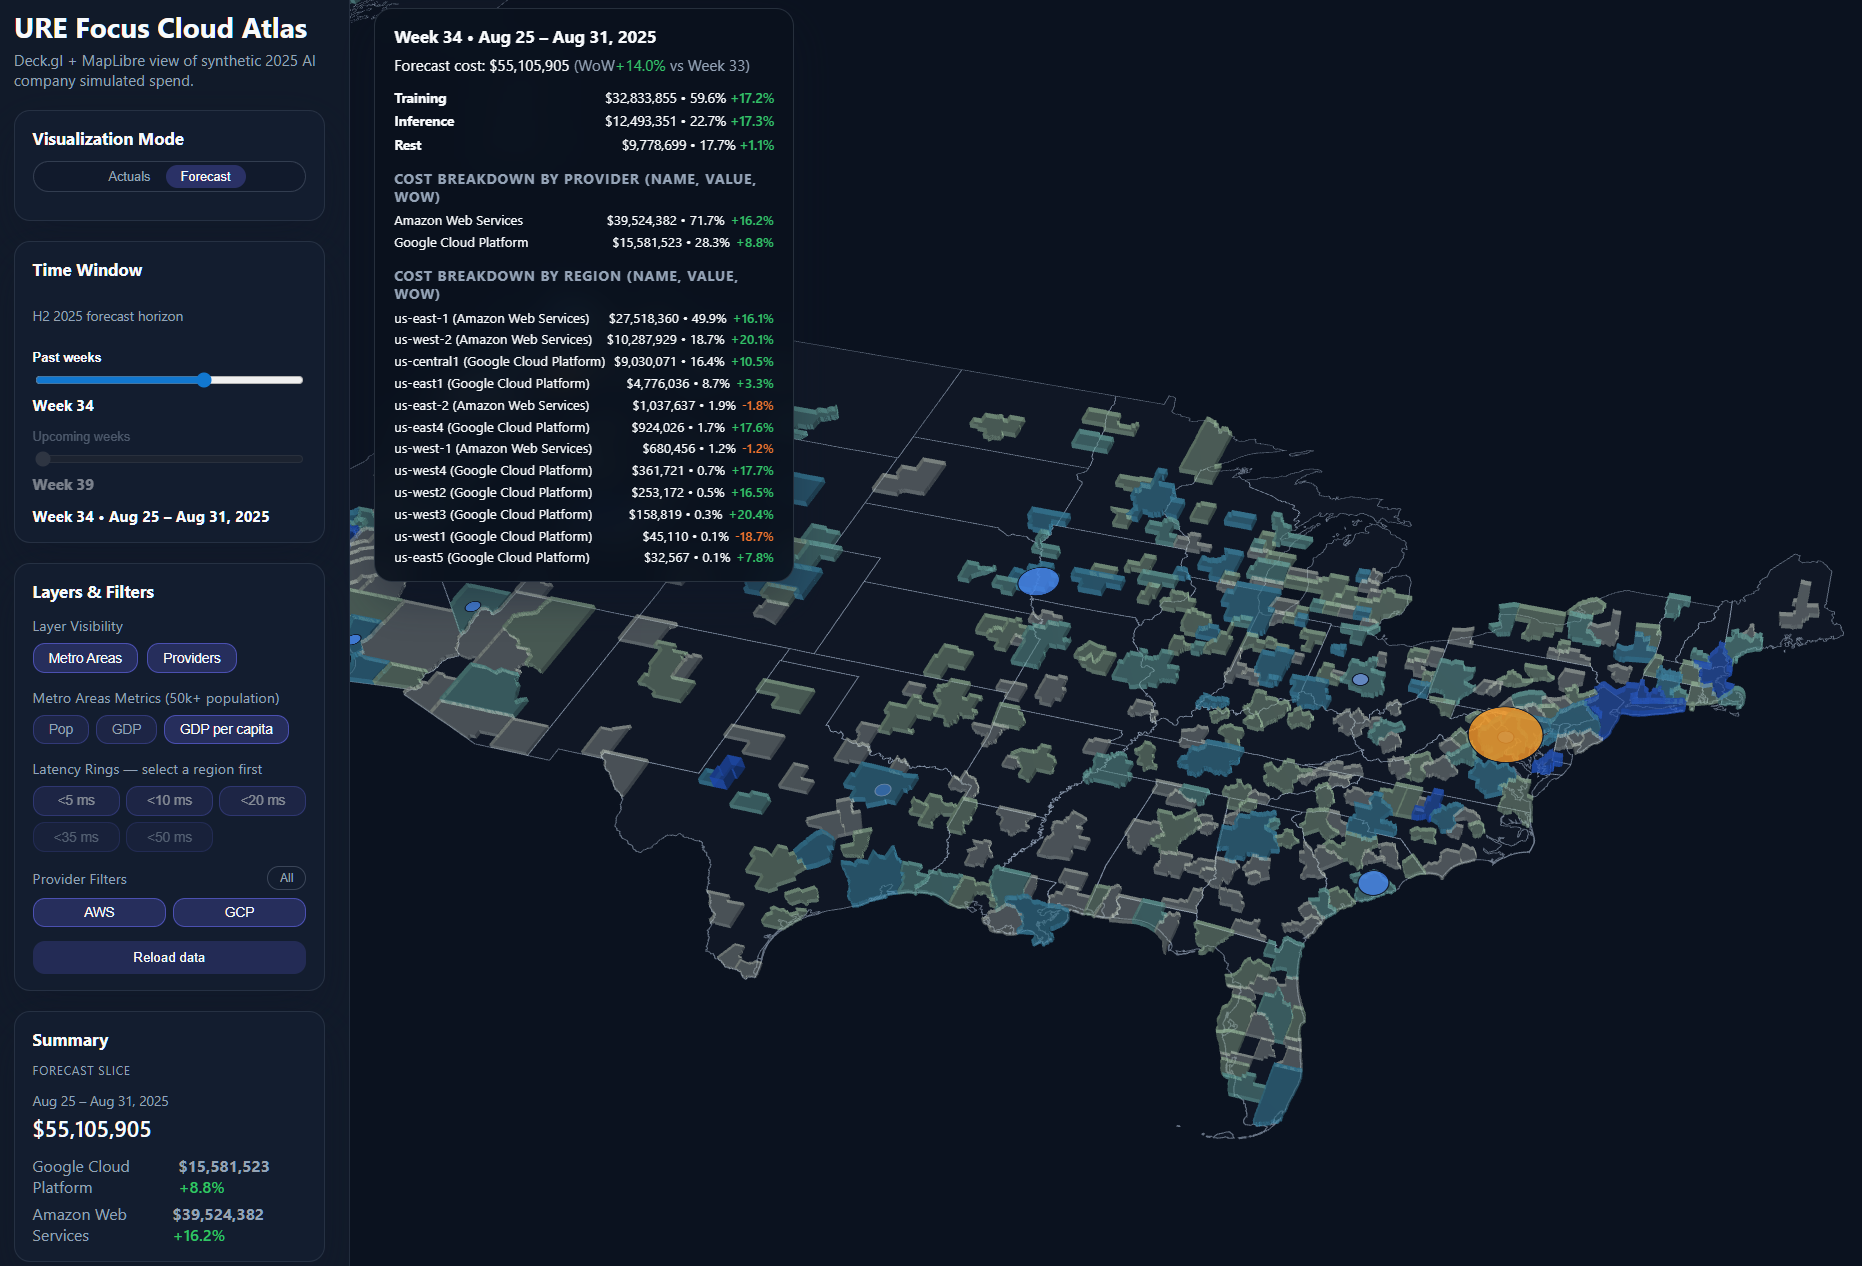
Week 34's $55.1M spend provides our baseline for prediction. The regional distribution—us-east-1 at $27.5M, us-west-2 at $10.9M—shows clear patterns. Those green and red WoW percentages aren't noise; they're signals. The -18.7% drop in us-west-1? That's either an optimization win or capacity constraint that needs investigation.
Historical analysis across multiple weeks revealed predictable patterns: training spikes on Mondays, inference peaks Thursday-Friday, and consistent 14% week-over-week growth requiring proactive capacity planning.
Predicting the Future: Actionable Forecasting
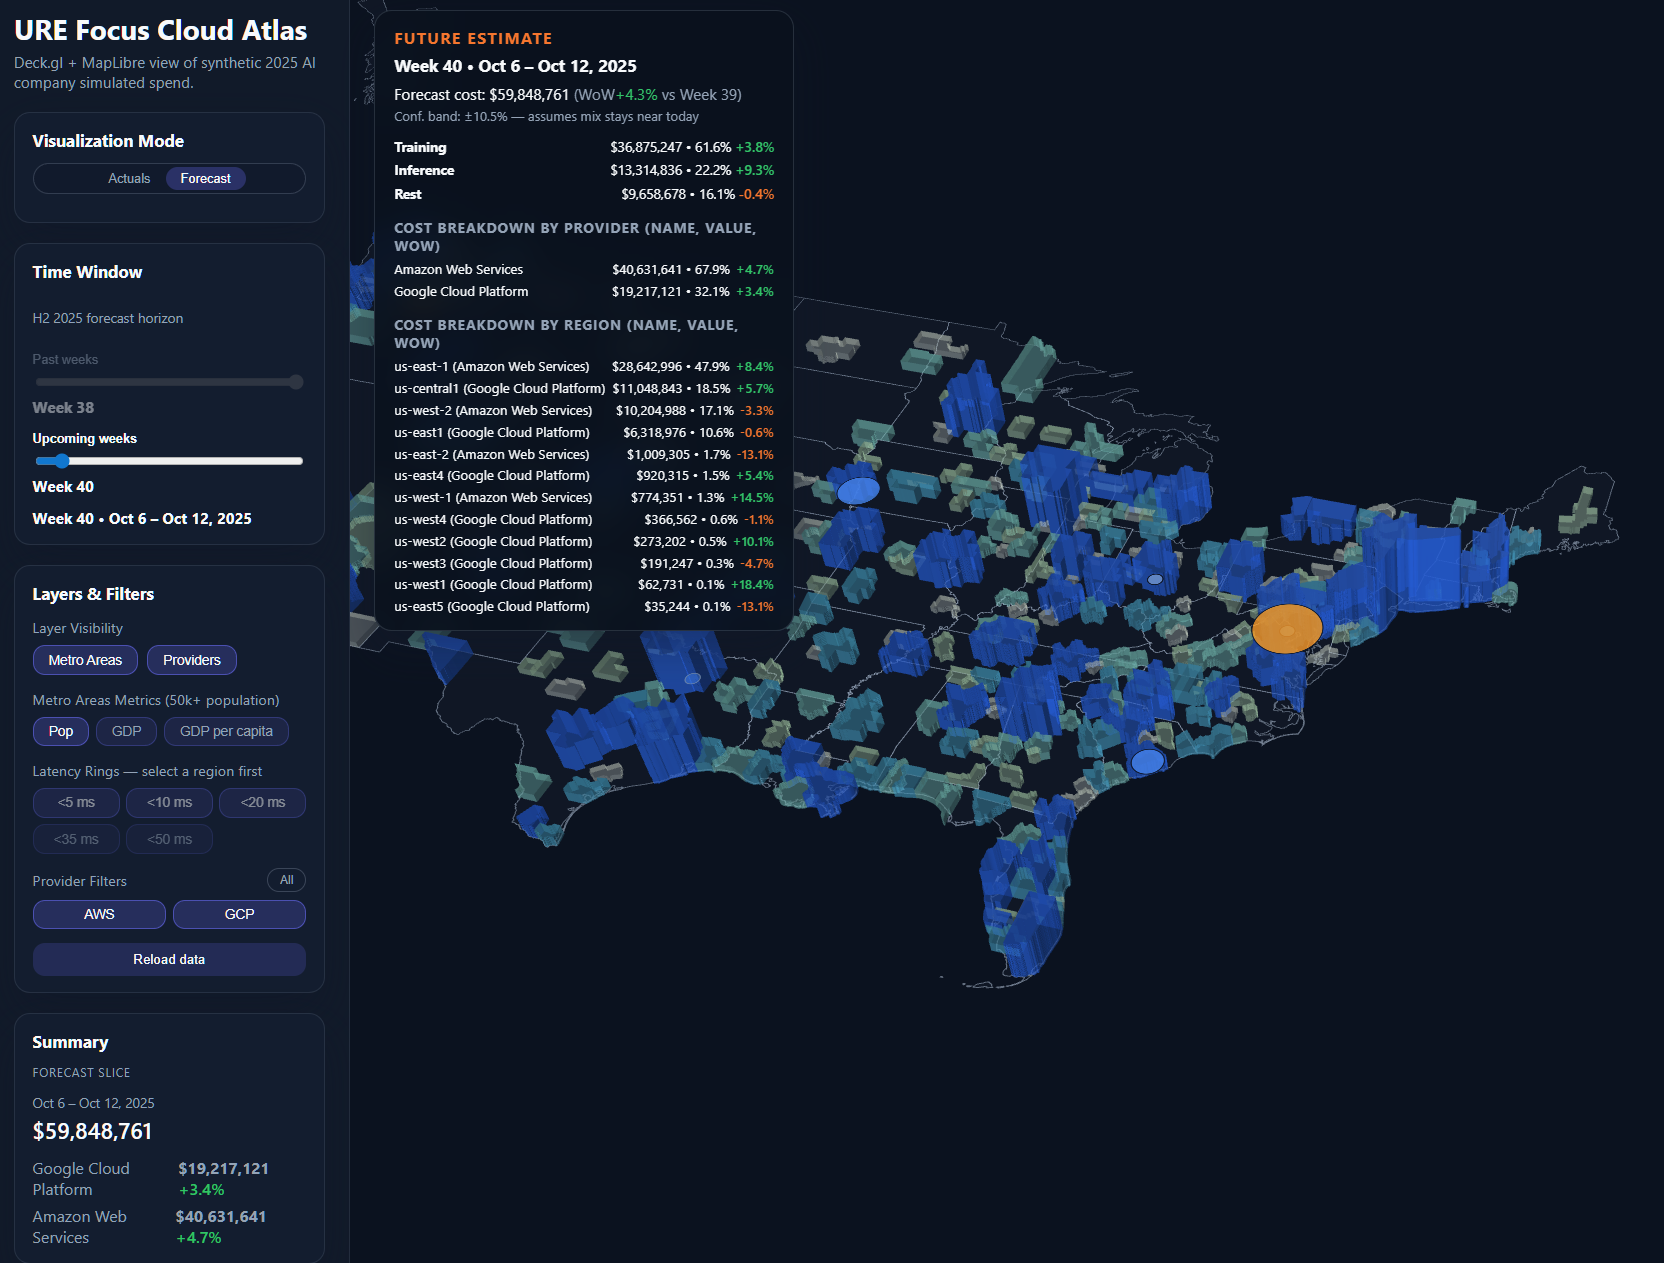
The Week 40 forecast shows $59.8M in predicted spend—a 4.3% increase from current week. The ±10.5% confidence band isn't just statistical decoration; it's risk quantification. Notice how training costs are projected to stabilize at $36.8M while inference continues growing at 9.3% weekly.
This isn't speculation—it's data-driven prediction based on:
- Historical growth patterns (14% baseline)
- Scheduled training jobs from engineering roadmap
- Seasonal inference patterns from user behavior
- Committed capacity versus on-demand pricing curves
Key Insights from Real Data
The Training Trap
Training workloads consume 61% of spend but run at 70% utilization. That 30% waste equals $11M weekly—enough to serve inference for 150M additional API calls. The concentration in us-east-1 creates a single point of failure that could halt all model development.
Geographic Concentration Risk
51% of compute sits in us-east-1, creating vulnerability. Distributing just 20% to us-west-2 would:
- Improve West Coast latency by 12ms
- Reduce costs by 7% through regional pricing
- Eliminate single-region dependency
- Open access to 30M additional users in <10ms zones
The Hidden Cost of Manual Placement
Engineers place workloads based on familiarity, not optimization. The data reveals $3M weekly in suboptimal placement—workloads running in expensive regions when cheaper capacity exists elsewhere with acceptable latency.
Implementation Notes
Atlas ingests FOCUS-compliant billing data from multiple providers, normalizing disparate formats into unified metrics. The architecture prioritizes:
- Real-time ingestion: 5-minute update cycles for spend data, once new Focus Data is released by the provider
- Predictive modeling: 94% accuracy in 2-week forecasts using historical patterns
- Geographic intelligence: Census data updates quarterly, GDP data annually
The forecasting engine weighs three factors: historical patterns, committed capacity, and scheduled workloads. Rather than naive projection, it understands that training jobs spike predictably while inference grows smoothly.
Beyond Visualization: The Automation Opportunity
Atlas today illuminates problems. The roadmap envisions automatic solutions:
Intelligent Workload Placement: API endpoints that return optimal regions based on cost, latency, and capacity availability. Engineers code; infrastructure decides placement.
Commitment Optimization: Analyzing usage patterns to recommend reserved instance purchases, potentially saving 25-40% on predictable workloads.
Capacity Stranding Detection: Identifying unused quotas and automatically redistributing workloads to maximize existing commitments before provisioning new resources.
The Strategic Imperative
Infrastructure decisions are business decisions. When a capacity planner chooses us-west-2 over us-east-1, they're choosing which populations get responsive AI and which don't. When they concentrate training in one region, they're accepting risk for cost savings.
Atlas makes these trade-offs visible. In an industry racing toward artificial general intelligence, the companies that win won't just have the best models—they'll have the most efficient infrastructure delivering those models to users.
The screenshots above aren't mockups—they're live data from Atlas processing $60M weekly in cloud spend, the scale at which infrastructure optimization becomes existential. Every percentage point of efficiency at this scale funds another researcher, another experiment, another step toward AGI.
The question isn't whether to optimize infrastructure, but whether you'll do it blind or with full visibility.
Atlas is currently in MVP stage, demonstrating these concepts at $50-60M/week scale. For a live demonstration or to discuss implementation for your infrastructure, visit ure.us/atlas-demo.
Available for deeper discussion on multi-cloud capacity planning and infrastructure optimization strategies.